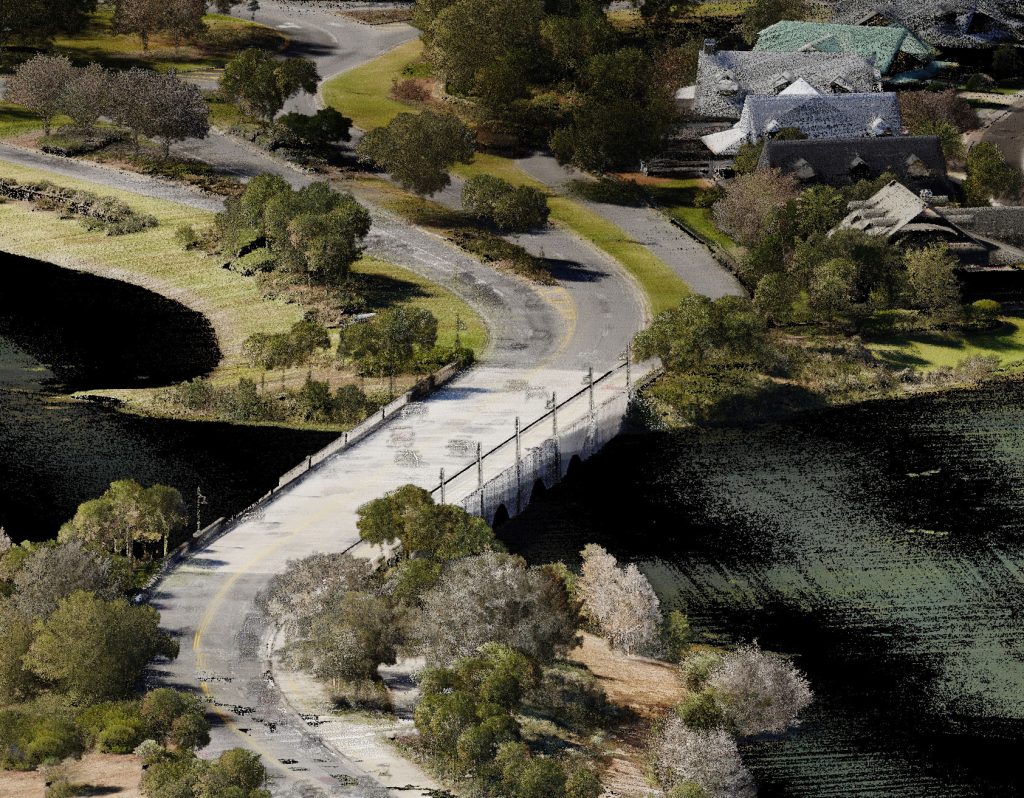
Seamless Data Integration: CFB’s GIS & Mapping division merges spatial data with various data streams to provide modern mapping services for our client’s projects.
Customized Solutions: The team is proficient in several software packages allowing us to offer tailored solutions, including real-time scheduling visualization and customized dashboards.
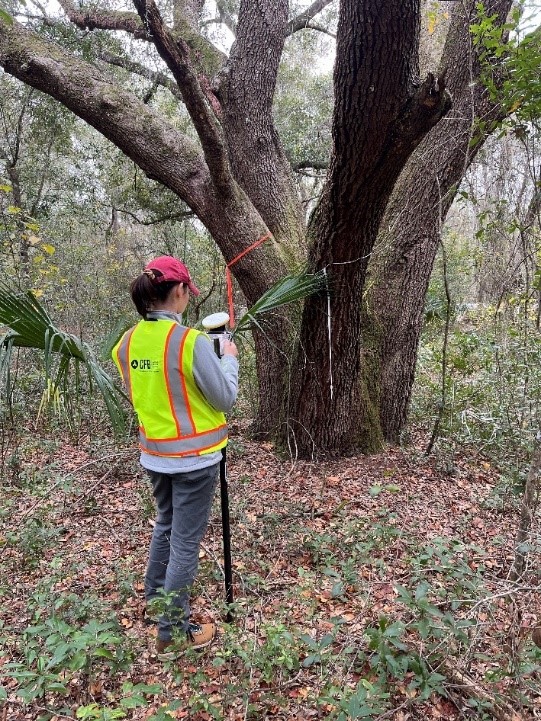
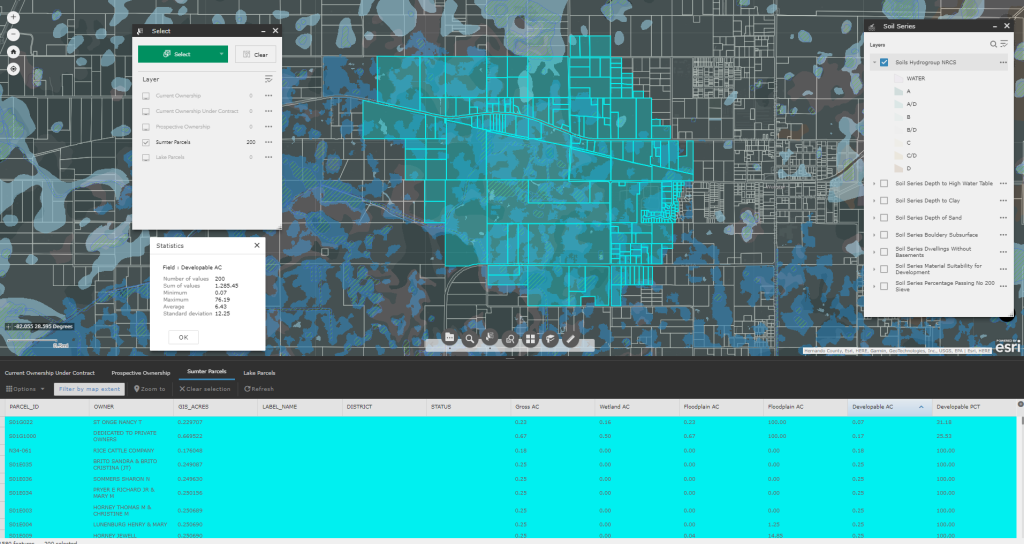
Curated Land Utilization Data: The GIS division at CFB has curated a comprehensive proprietary repository of regional land utilization data and metrics. This resource uniquely empowers a focus on tailored information for plan amendments, rezonings, and annexations. A dedicated team of in-house programmers and analysts maintains these datasets to meet specific client needs.
Proud to be part of the Esri Partner Network.
Founded in 1969, Esri has become the global market leader in geographic information system (GIS) software, location intelligence, and mapping.
As a partner we collaborate with Esri to help users maximize their GIS and location technology investments.
Experience the difference that decades of expertise, a broad skill set, and a client-focused approach can make in your next project.
GIS & Mapping Team consists of:
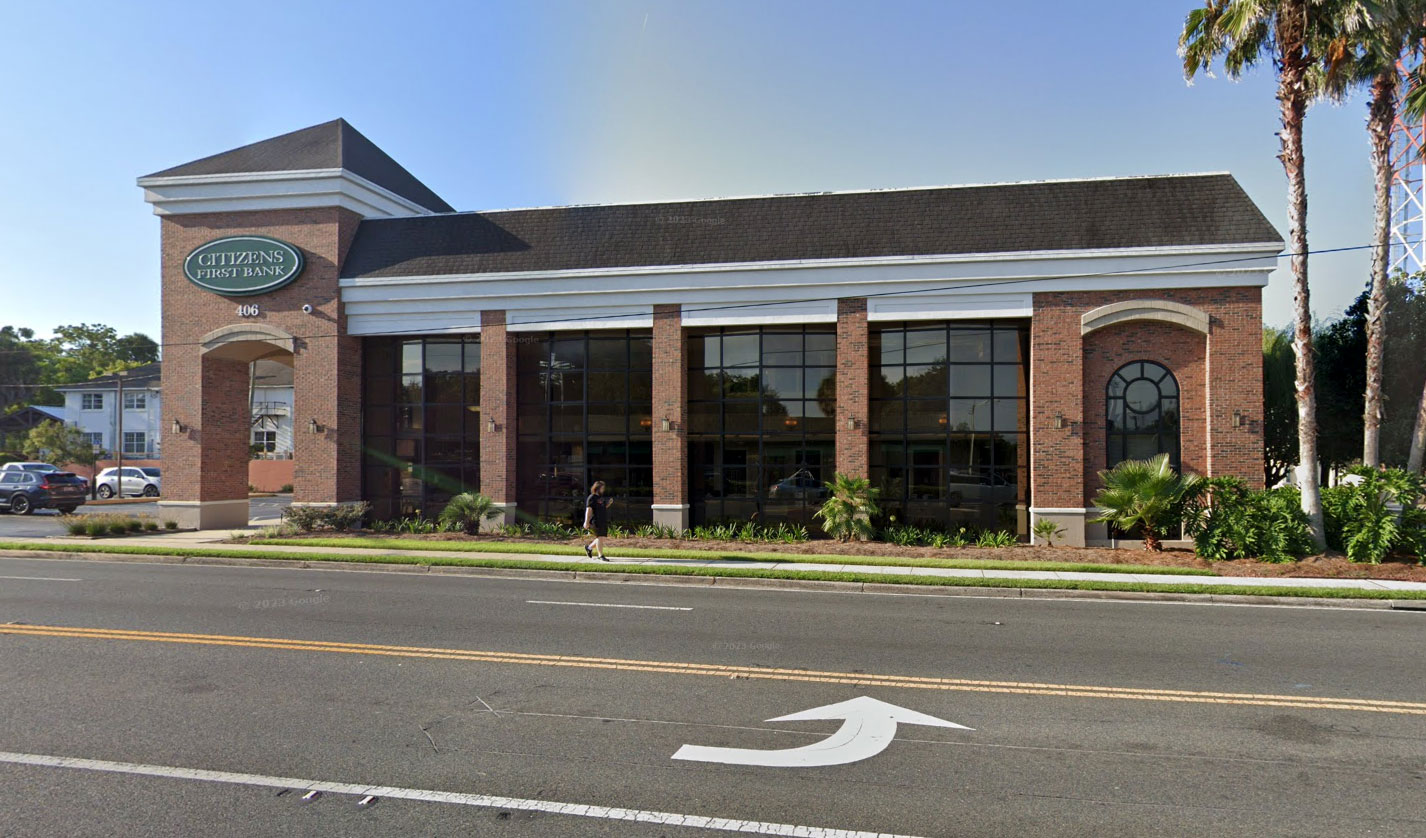
We're excited to announce that our Wildwood Headquarters has moved to its new location in Middleton!